Stock Price Prediction With Sentiment Analysis
Data Science Student Society - Projects Team
Authors: Kevin Jay, Maitrayee Keskar, Rishabh Viswanathan, Xavier (Xuewei) Yan
Introduction
We can often see that, in the use of time series models, there exist large differences between the actual value and that value which was predicted. Can we find an explanation for these differences? What is missing in the Time Series Model?
When we consider the price movements of various stocks, we can separate our understanding of the underlying catalysts into two areas, historical trends and breaking news. Our time series models do an excellent job of predicting movements based upon past trends, but can we find a way to incorporate how a certain piece of breaking news will affect the price?
The basic logic of the problem at hand is the following. Breaking news will inherently affect the attitude of traders toward a particular company. Thus, this will in turn affect their buy/sell decisions, and ultimately we will see a change in the stock price as a result. The problem of directly estimating the positivity/negativity of an individual article is too difficult, but we can circumvent this by instead analyzing the comments under the news on high-traffic sites. We can use these comments to analyze how people are reacting to a certain piece of news regarding a company, and use the resulting values to help improve our predictions!
Data Collection and Preparation
We used over 80,000 tweets, only querying tweets which directly mentioned any of our companies at hand from 1-2-2020 to 11-13-2020. Ideally, these tweets regarding current news for these companies will help us to augment our model. Below, we can see the chosen companies (FAANG, TSLA).
Machine Learning and Model Building
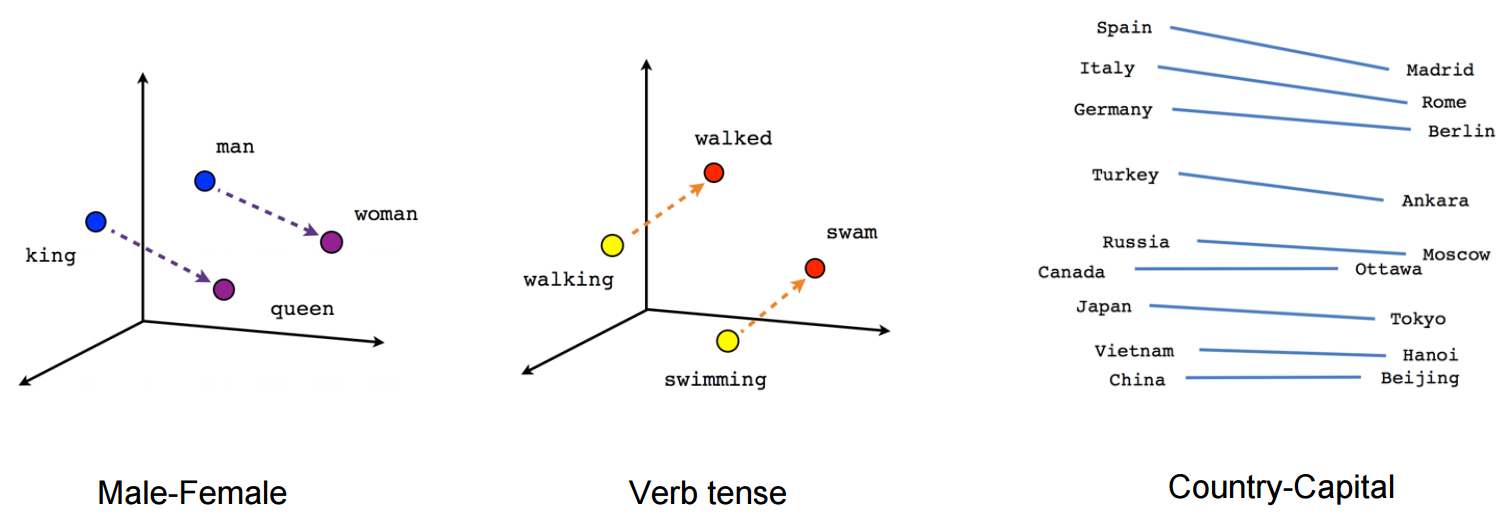
To determine the sentiment of the tweets, we used a deep neural network Word2Vec model, which embeds the analogical relationships between words. We used the spaCy library to vectorize the sentences. Our model used 300 inputs (vectorized sentences), with 7 hidden layers and 2 outputs, corresponding to the probability that a given tweet was negative or positive.
Results
Daily Sentiment Mean for Sample Companies
We can see a wide spread of projected sentiment for each of the companies in our sample. We can see that most of the companies have an average that is above zero, meaning that they usually have a slight positive sentiment from the populus. Facebook is the only company in our sample that has a negative average, which is hardly surprising. Next, we will take a look at how our time series model is performing without any augmentation.
We can see that our predictions from our simple time series model (ARIMA) are usually quite accurate, but fall short in times of heavy volatility. Next, we will consider a graph which shows the differences between the ARIMA prediction and the actual values.
Here is an example date range where we can see the differences between the ARIMA and the actual price. Interestingly, if we superimpose our sentiment charts for the same date range, we can see almost an exact match in many areas.
We can see that our sentiment, while in many cases exaggerates the movements, moves in the same direction at the same time extremely often! In some cases, it is unclear whether the movement of the sentiment is happening before, or after the price movement itself, thus it is unclear whether it is a catalyst toward the price movement or a reaction to it. Still, the relationship between the two is highly significant.
Conclusion
Through our generated estimate of consumer sentiment, we are able to very accurately predict the cases in which our time series prediction is different than the actual price. If we were to create a model that combined the two, it is likely that it would not fall under the same difficulties that our original time series model did, and we would use this new feature as a staple in future models. In terms of future improvements, it is likely that the inclusion of even more data for both more companies and more tweets could strengthen our results.


